FilteredGridView examples
In this example we use filteredGridView to filter out parts of a given grid view.
[1]:
from ufl import SpatialCoordinate, dot
from dune.grid import cartesianDomain
from dune.alugrid import aluConformGrid as leafGridView
from dune.fem.view import filteredGridView
from dune.fem.space import lagrange
Create a host grid view of the underlying grid as usual.
[2]:
gridView = leafGridView( cartesianDomain([0,0],[1,1],[16,16]) )
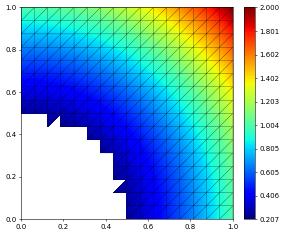
Now create a filteredGridView with a simple callable specifying which element belongs to the new domain.
[3]:
filteredView = filteredGridView(gridView, lambda e: e.geometry.center.two_norm > 0.5, domainId=1)
space = lagrange(filteredView, order=2)
x = SpatialCoordinate(space)
solution = space.interpolate(dot(x,x),name="solution")
solution.plot()
print("number of dofs:", solution.size,\
      "integral over filtered domain",solution.integrate())

number of dofs: 1089 integral over filtered domain 0.6413014729817705
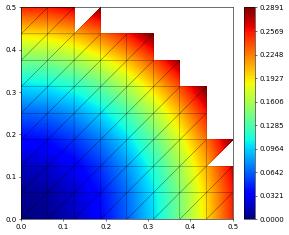
Revert the filter and create a filteredGridView with also provides an overloaded index set with a consecutive index for the entities belonging to the new domain.
[4]:
filteredView = filteredGridView(gridView, lambda e: e.geometry.center.two_norm < 0.5, domainId=1,
                                useFilteredIndexSet=True)
space = lagrange(filteredView, order=2)
x = SpatialCoordinate(space)
solution = space.interpolate(dot(x,x),name="solution")
solution.plot()
print("number of dofs:", solution.size,\
      "integral over filtered domain",solution.integrate())

number of dofs: 239 integral over filtered domain 0.025365193684895825
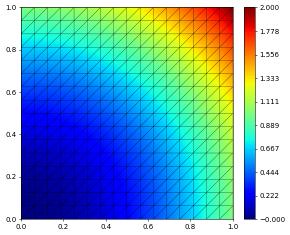
Compare with the original grid view.
[5]:
space = lagrange(gridView, order=2)
solution = space.interpolate(dot(x,x),name="solution")
solution.plot()
print("number of dofs:", solution.size,\
      "integral over filtered domain",solution.integrate())

number of dofs: 1089 integral over filtered domain 0.6666666666666667